Data analysis using F# and Jupyter notebook
During the last hackathon at @justeattech, I’ve played a lot around machine learning using ML.NET and .NET Core. Furthermore, the idea that a .NET developer is able to implement machine learning without switching language is cool. ML.NET has still a lot of space of improvement, but it could be a powerful framework to deal with machine learning.
The following post focuses on some general knowledge around data gathering and data analysis. Furthermore, it explains some basics tools to perform data analysis using F# and Jupyter notebook.
The importance of the data foundations
The data set gathering is the more critical step around machine learning. Data is the foundation of all the further process, and it the principal step of the ML workflow.
Therefore, it is crucial to understand the data that we are going to use and to train a machine learning model. For that reason, it is important to prototype and explores data before the start.
Lyrics data analysis
The purpose of the following example is to give some basic notions about the data analysis process. As a software engineer mainly focused on .NET Core, I will use the technologies around the .NET ecosystem. Therefore, the example will use F# as the primary language and some related libraries to handle data. The example is also available at the following Github repository: https://github.com/samueleresca/LyricsClassifier
It is essential to consider that most of the concepts of the following steps are independent of the language or the libraries we use. Moreover, almost all the languages and development frameworks come with some open-source tools for machine learning and data analysis. Here is a complete of machine learning libraries and frameworks: https://github.com/josephmisiti/awesome-machine-learning
More in specific, the following example will use the following libraries:
XPlot.Plotly: XPlot is a cross-platform data visualization library that supports creating charts using Google Charts and Plotly. The library provides a composable domain-specific language for building charts and specifying their properties;MathNet.Numerics: Math.NET Numerics aims to provide methods and algorithms for numerical computations in science, engineering, and everyday use. Covered topics include special functions, linear algebra, probability models, random numbers, interpolation, integration, regression, optimization problems and more;FSharp.Data: the F# Data library implements everything you need to access data in your F# applications and scripts. It contains F# type providers for working with structured file formats (CSV, HTML, JSON, and XML) and for accessing the WorldBank data. It also includes helpers for parsing CSV, HTML and JSON files and for sending HTTP requests;ML.NET: ML.NET is a machine learning framework built for .NET developers;
Data schema
The example will use a dataset of lyrics available on Kaggle. The data set contains a list of songs of different genres and from several artists. The data has a straightforward schema, which can be represented using the following F# type:
The Song field refers to the title of the song, the Artist field contains the artist name, the Year is the release date, the Genre field contains the genre of the song and finally, the Lyrics field refers to the lyrics of the song.
Finally, let’s take a look to a preview of the input data:
A first look at the data
The data set gathering is the more critical step around machine learning. Data is the foundation of all the further process, and it the main dependency of the ML workflow.
We should always keep in mind is that data is the primary and the critical part for all the subsequent step. Just like some software engineering design processes use the structure of the data to build the domain model of the system, in the same way, we should start from our data to have a global view on the content.
Let’s start by analyzing the lyrics dataset to find out the possible correlations. For this propose, the example uses Jupyter notebook. Jupiter notebook is a useful tool which allows you to create and share documents that contain live code, equations, visualizations, and narrative text. You can find the source code of Jupyter notebook on GitHub: https://github.com/jupyter/notebook. By default, Jupyter notebook supports Python as a primary language. For this example, we can enable the support of F# by using the following library using https://github.com/fsprojects/IfSharp.
As a first step, we can start Jupyter and create a new notebook in our preferred folder. Then, we can proceed by importing the F# libraries describes above in the first cell of the notebook:
The snippet uses the Paket package manager to load the libraries used in the notebook. After that, we can proceed by opening the namespaces used by the notebook and defines the input type which reflects the structure of the dataset:
Once we defined the LyricInput type we can proceed by reading the lyrics.csv file and clean up our dataset:
The following snippet uses the FSharp.Data library to load the CSV file, and it performs some filtering and data cleaning on our lyrics:
- It removes all the samples with empty lyrics;
- It removes all the samples equals to
[Instrumental]; - Finally, it maps the rows with the
LyricInputtype defined above;
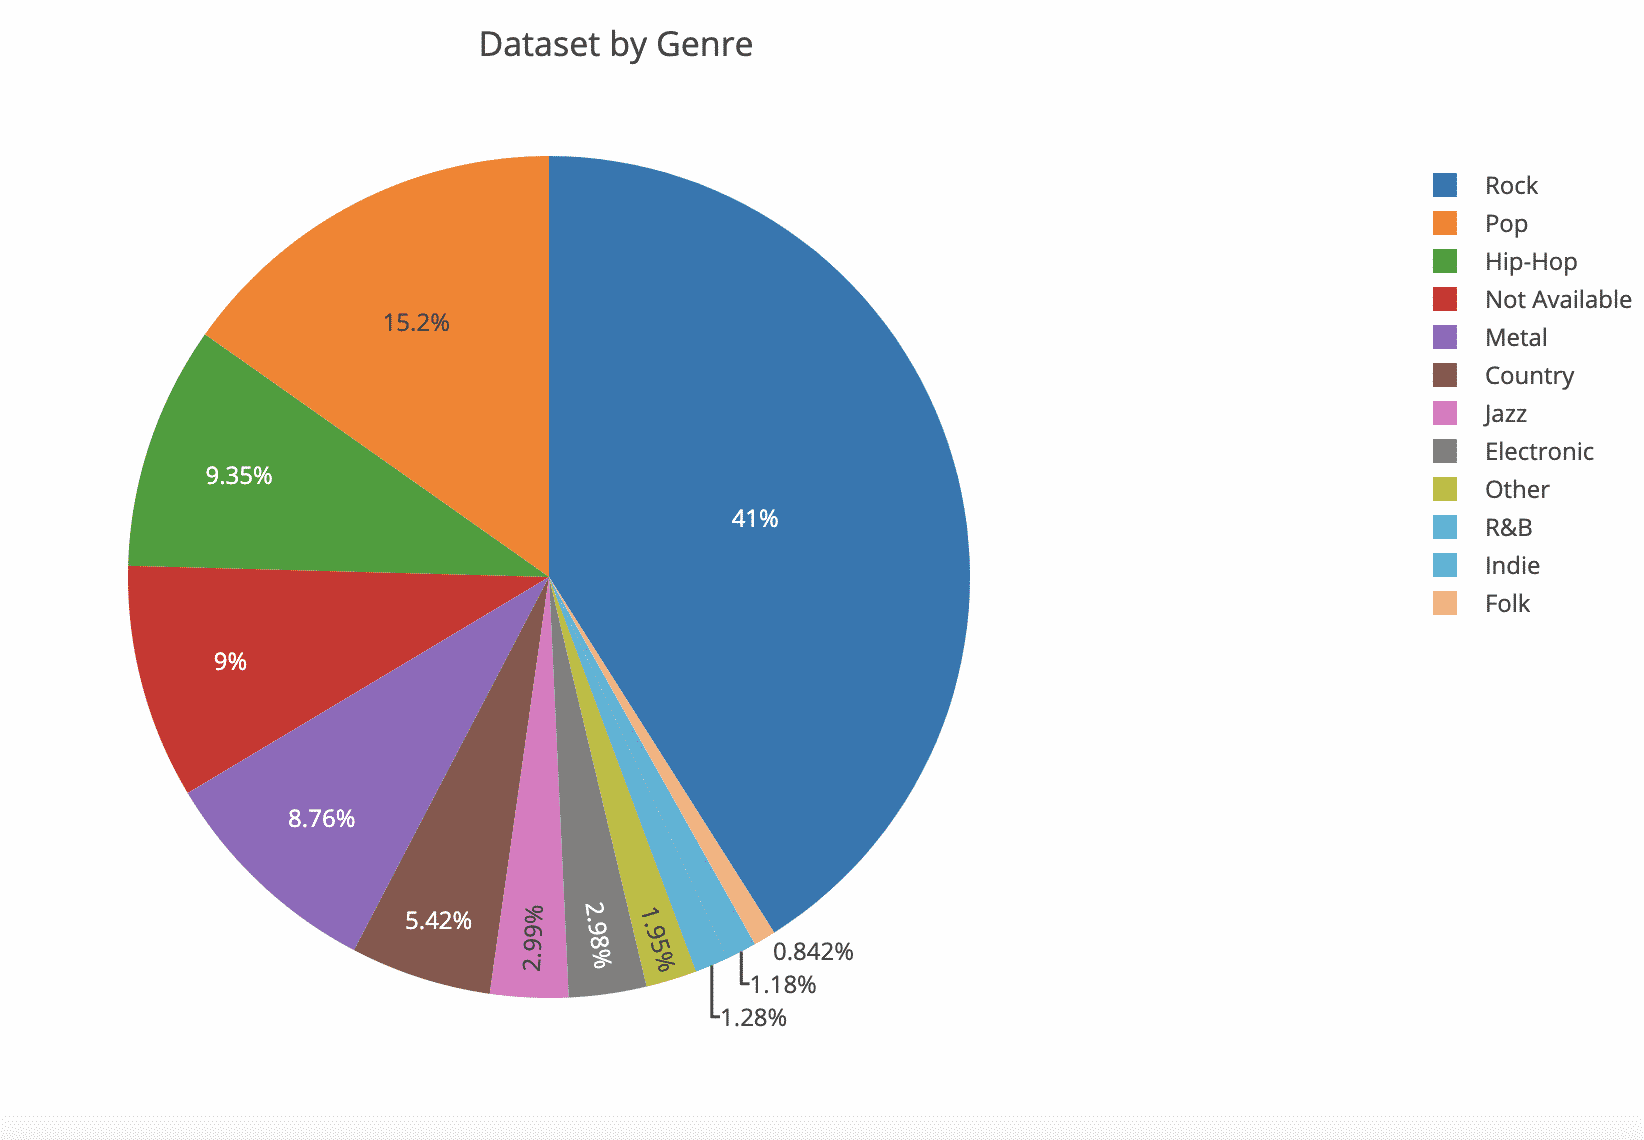
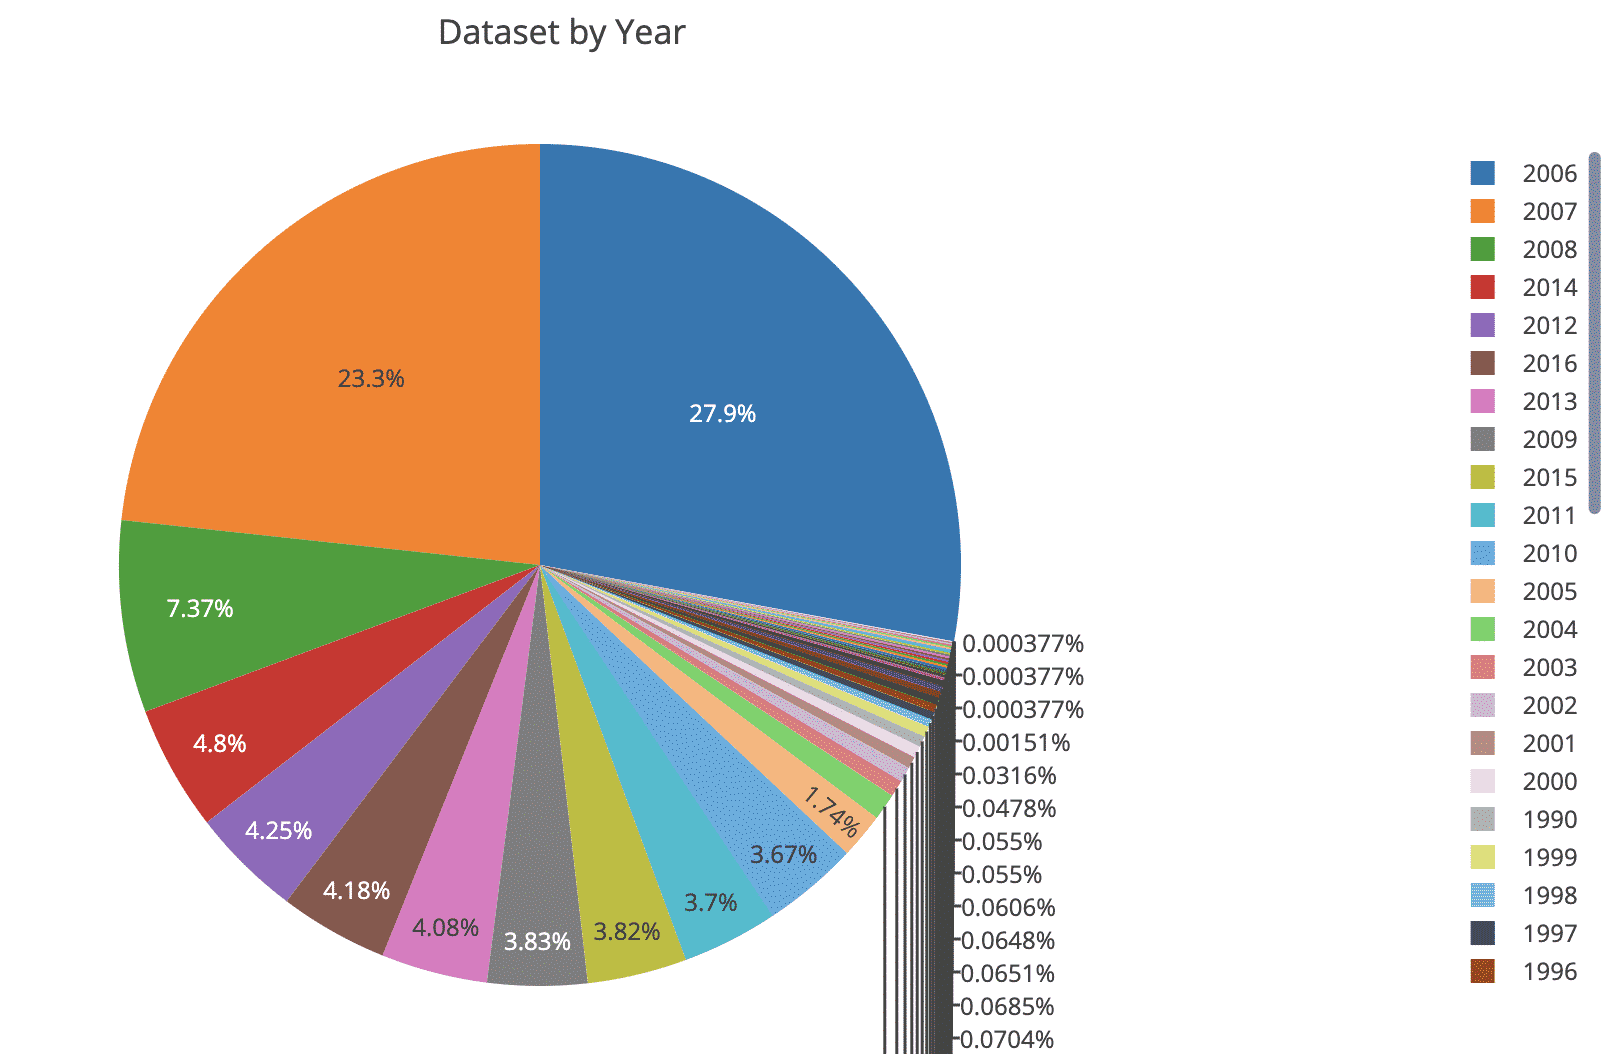
Let’s proceed by make a quick analysis of the critical feature of the dataset and see all the possible correlation. The following code is for rendering two Chart.Pie related to the Genre and the Year feature:
The above snippet uses the XPlot.Plotly library to render the following charts:

The above charts describe the dataset lyrics by genre. In the same way, we can group the songs by using Year field, in order to understand the distribution over time:

Feature and data engineering using ML.NET
Let’s continue by focusing on the Lyrics field by visualizing the frequency of the words used in the lyrics, both at the global level and also by genre. First of all, we should start a tokenization process. This process runs using the following snippet of code:
The code snippet defines a list of stopwords and a list of symbol. These variables are used by the tokenizeLyrics function which returns the list of words related to a lyric.
Besides, the tokenizeLyrics function uses the text transformation methods provided by ML.NET. More in detail, the tokenizeLyrics function defines a new MLContext object which is provided by the Microsoft.ML namespace. Next, the function runs the mlContext.Data.LoadFromEnumerable method to load the lyrics sequence into the mlContext. The tokenizeLyrics function calls some utilities provided by the mlContext.Tranforms.Text static class:
FeaturizeText("FeaturizedLyrics", "Lyrics")transform the Lyrics text column, in that case, theLyricsfield, into featurized float array that represents counts of n-grams and char-gram;NormalizeText("NormalizedLyrics", "Lyrics")normalizes incoming text of the input column by changing case, removing diacritical marks, punctuation marks and/or numbers and outputs new text in the output column;TokenizeWords("TokenizedLyric", "NormalizedLyrics", symbols)tokenizes incoming text in the input column using the separators provided as input. Then, it assigns the outputs the tokens to the output column;RemoveStopWords("LyricsWithNoCustomStopWords", "TokenizedLyric", stopwords)removes the list of stopwords from incoming token streams provided as input and it outputs the token streams in the output column;RemoveDefaultStopWords("LyricsWithNoStopWords", "TokenizedLyric")behaves in the same way of theRemoveStopWordsexcept that it uses a default list of stopwords, thus it is also possible to specify them in different languages
It is also important to notice that the columns on the right are the input columns, and the ones on the left contain the output. Furthermore, it also possible to use the .Append method to compose a dataset of multiple columns, each of them, will contain a resulting output column.
Finally, the last step of the tokenizeLyrics function is to transform the data and put all the tokenized words together using the following instructions:
After that, it is possible to call the tokenizeLyrics function as follow:
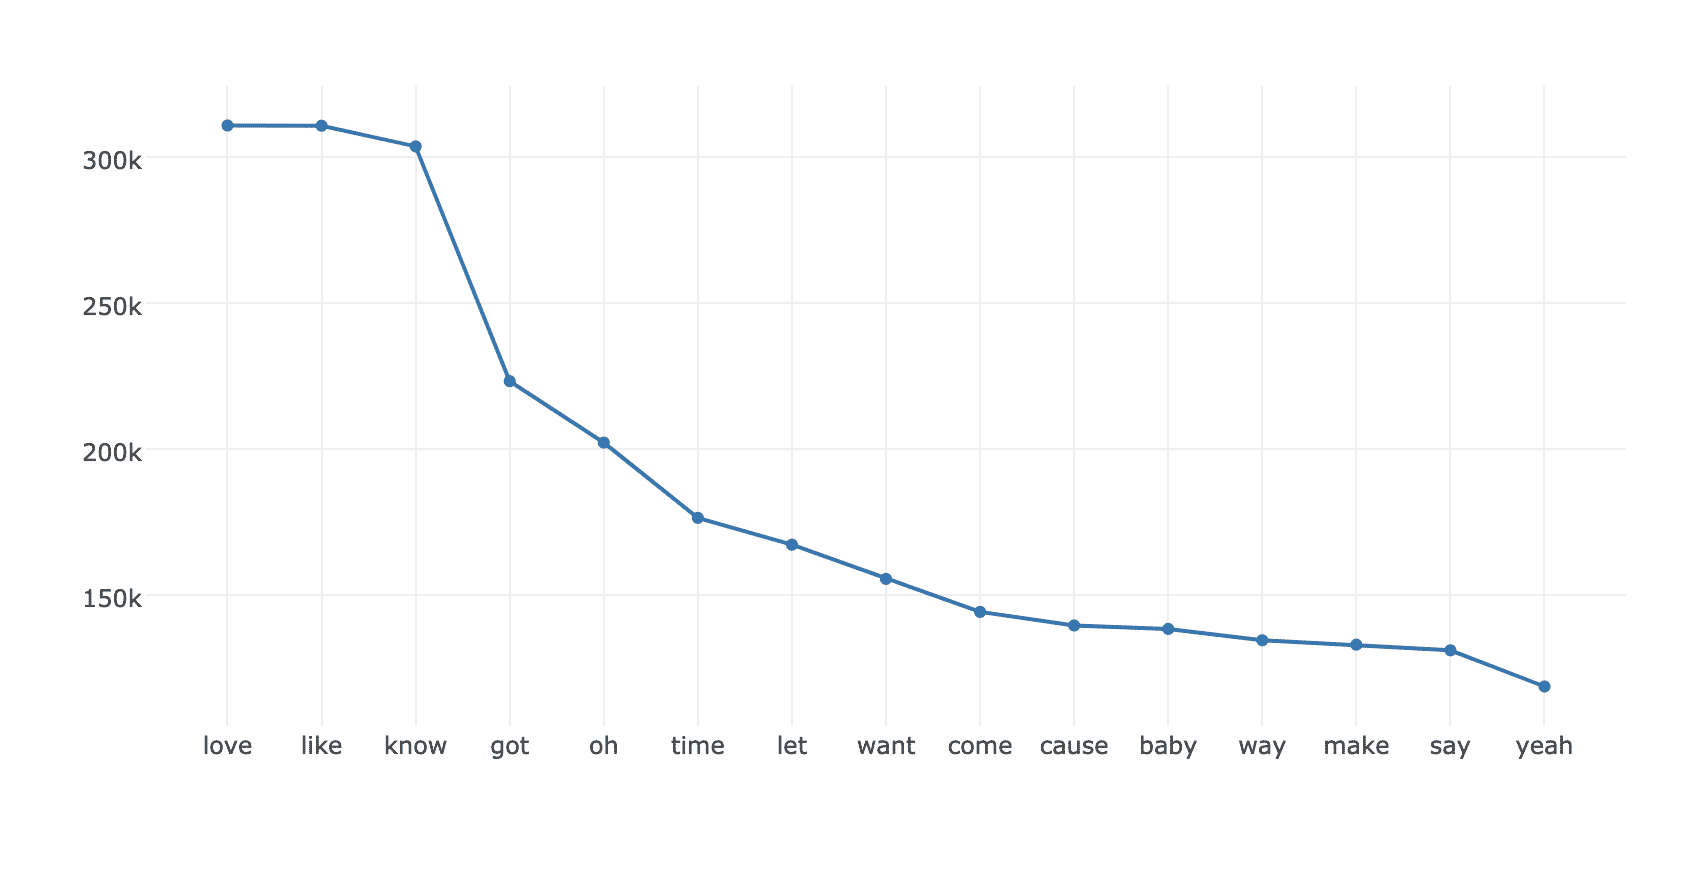
The resulting chart shows all the top 20 most frequent words presents in all the lyrics:

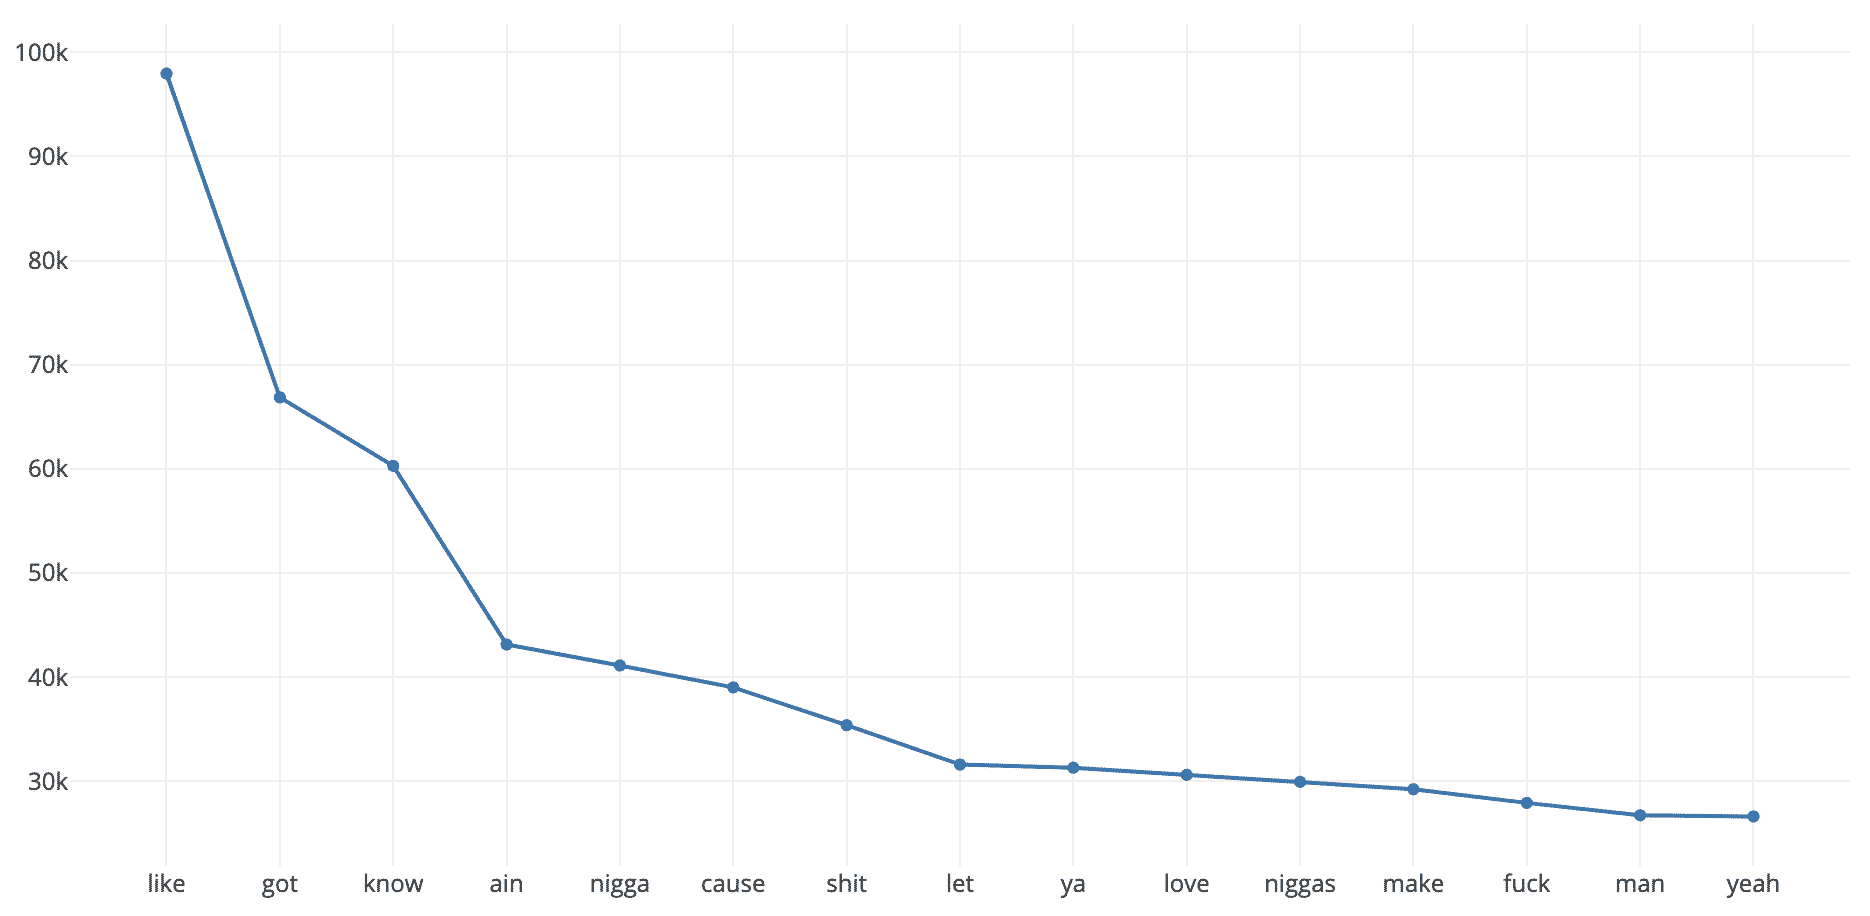
Furthermore, it is also possible to check the top 20 most frequent words by Genre field using the following snippet:
For example, in that case, the resulting chart is the most popular word frequencies in Hip-Hop lyrics:

Final thoughts
This post provides some general knowledge around data analysis using Jupyter notebook and F#. It shows how Jupyter notebook can be used to fast prototype and understand the data models. Moreover, ML.NET provides the tools to perform feature engineering on our data and set up the data model for the initialization. In the next post, we will see how to train a model that detects a genre depending on the song lyrics. The above example is available on GitHub at the following URL: https://github.com/samueleresca/LyricsClassifier
References:
https://www.kaggle.com/corizzi/lyrics-genre-analysis-machine-learning
Cover image by Benjamin Benschneider